|
Enter content here |
Enter content here The System Dynamics of an "Intention" Economy
|
 |
|
The System Dynamics of an "Intention" Economy Here's an attempt to capture the Doc Searls notions from "The Intention Economy" in systems dynamics language. The way to read system dynamics diagrams is to see each item as though it were a quantity (even imagine intangible things like “Trust” as though it could be measured with some trust meter). Then the diagram is about the relationship of one quantity to another. For example, if one did a diagram of the system of “eggs” and “chickens” it would indicate that when the quantity of chickens goes up, the quantity of eggs go up and when the quantity of eggs goes up the quantity of chickens goes up. This would be reinforcing loop. Now introduce (Road Crossings) as in "Why did the chicken cross the road?". A loop would show that the more road crossing, the fewer chickens and the fewer chickens the fewer road crossings -- a balancing loops. In the simple charts here, all are reinforcing loops except one (marked by a letter "O" for "Opposite). 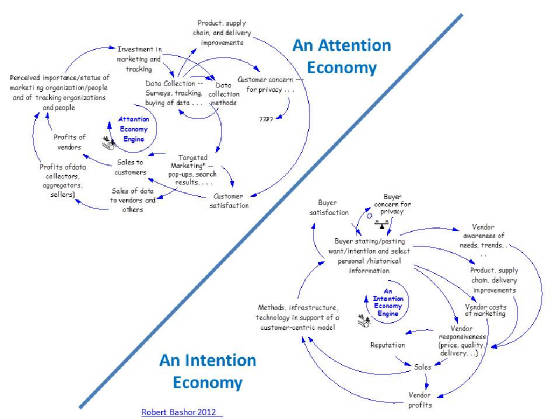 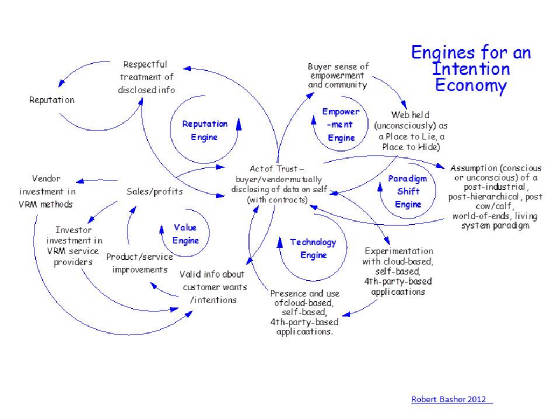 |